效果图:
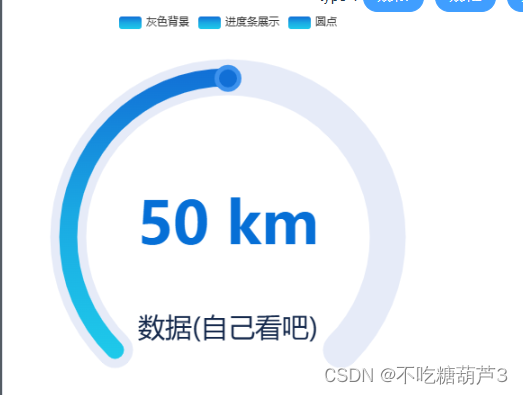
代码如下:
<template>
  <div>
    <!-- 图表 -->
    <div class="echart-box" id="main"></div>
  </div>
</template>
<script setup>
import * as echarts from "echarts";
import { onMounted } from "vue";

//声明周期函数,自动执行初始化
onMounted(() => {
  init();
});
//初始化函数
function init() {
  // 基于准备好的dom,初始化echarts实例
  let Chart = echarts.init(document.getElementById("main"));
  // 绘制图表
  let options = {
    tooltip: {
      formatter: "{a} <br/>{b} : {c}%",
    },
    color: {
      type: "linear",
      x: 0,
      y: 0,
      x2: 0,
      y2: 1,
      colorStops: [
        {
          offset: 0,
          color: "#116fd6", // 0% 处的颜色
        },
        {
          offset: 0.5,
          color: "#1aa9e3", // 0% 处的颜色
        },
        {
          offset: 1,
          color: "#1ecaea", // 100% 处的颜色
        },
      ],
      global: false, // 缺省为 false
    },
    itemStyle: {
      borderWidth: 50,
    },
    legend: {},
    series: [
      {
        name: "灰色背景",
        type: "gauge",
        radius: "79%",
        pointer: {
          // 仪表盘指针。
          show: false,
        },
        splitLine: {
          // 仪表盘轴线(轮廓线)相关配置。
          show: false,
        },
        axisTick: {
          show: false,
        },
        // 仪表盘轴线(轮廓线)相关配置。
        axisLine: {
          show: true, // 是否显示仪表盘轴线(轮廓线),默认 true。
          roundCap: true,
          lineStyle: {
            opacity: 1, //图形透明度。支持从 0 到 1 的数字,为 0 时不绘制该图形。
            width: 40, //轴线宽度,默认 30。
          },
        },

        axisLabel: {
          // 刻度标签。
          show: false,
        },
      },
      {
        name: "进度条展示",
        type: "gauge",
        progress: {
          show: true,
          width: 20,
          roundCap: true,
        },
        // startAngle: 170, // 仪表盘起始角度,默认 225。圆心 正右手侧为0度,正上方为90度,正左手侧为180度。
        // endAngle: -45, // 仪表盘结束角度,默认 -45
        // clockwise: true, // 仪表盘刻度是否是顺时针增长,默认 true。
        // min: 0, // 最小的数据值,默认 0 。映射到 minAngle。
        // max: 100, // 最大的数据值,默认 100 。映射到 maxAngle。
        // splitNumber: 10, // 仪表盘刻度的分割段数,默认 10。
        itemStyle: {
          // 仪表盘指针样式。
          // color: "auto", // 指针颜色,默认(auto)取数值所在的区间的颜色
          // opacity: 1, // 图形透明度。支持从 0 到 1 的数字,为 0 时不绘制该图形。
          // borderWidth: 5, // 描边线宽,默认 0。为 0 时无描边。
          // borderType: "solid", // 柱条的描边类型,默认为实线,支持 'solid', 'dashed', 'dotted'。
          // borderColor: "#ebf3fc", // 图形的描边颜色,默认 "#000"。支持的颜色格式同 color,不支持回调函数。
          // shadowBlur: 0, // (发光效果)图形阴影的模糊大小。该属性配合 shadowColor,shadowOffsetX, shadowOffsetY 一起设置图形的阴影效果。
          // shadowColor: "#ebf3fc", // 阴影颜色。支持的格式同color。
        },
        // 仪表盘指针。
        pointer: {
          show: false,
        },
        splitLine: {
          // 仪表盘轴线(轮廓线)相关配置。
          show: false,
        },
        axisTick: {
          show: false,
        },
        // 仪表盘轴线(轮廓线)相关配置。
        axisLine: {
          show: false,
        },

        axisLabel: {
          // 刻度标签。
          show: false,
        },
        title: {
          fontSize: 30,
          offsetCenter: [0, "55%"],
          color: "#15294c",
        },
        detail: {
          valueAnimation: true,
          fontSize: 65,
          fontWeight: "bolder",
          formatter: "{value} km",
          offsetCenter: [0, "-5%"],
          color: "#066fd6",
        },
        data: [
          {
            value: 50,
            name: "数据(自己看吧)",
          },
        ],
      },
      {
        name: "圆点",
        type: "gauge",
        progress: {
          show: false,
        },
        pointer: {
          // 仪表盘指针。
          icon: "circle",
          width: 25,
          offsetCenter: [0, -120],
          itemStyle: {
            color: "#116fd6",
            borderColor: "#3d92ed",
            borderWidth: 5,
          },
        },
        splitLine: {
          // 仪表盘轴线(轮廓线)相关配置。
          show: false,
        },
        axisTick: {
          show: false,
        },
        axisLine: {
          show: false,
        },
        axisLabel: {
          // 刻度标签。
          show: false,
        },
        data: [
          {
            value: 50,
          },
        ],
        detail: {
          show: false,
        },
        zlevel: 100,
      },
    ],
  };

  // 渲染图表
  Chart.setOption(options);
}
</script>

<style scoped>
.echart-box {
  width: 500px;
  height: 500px;
  color: #6d54c6;
}
</style>
